


- Soluciones
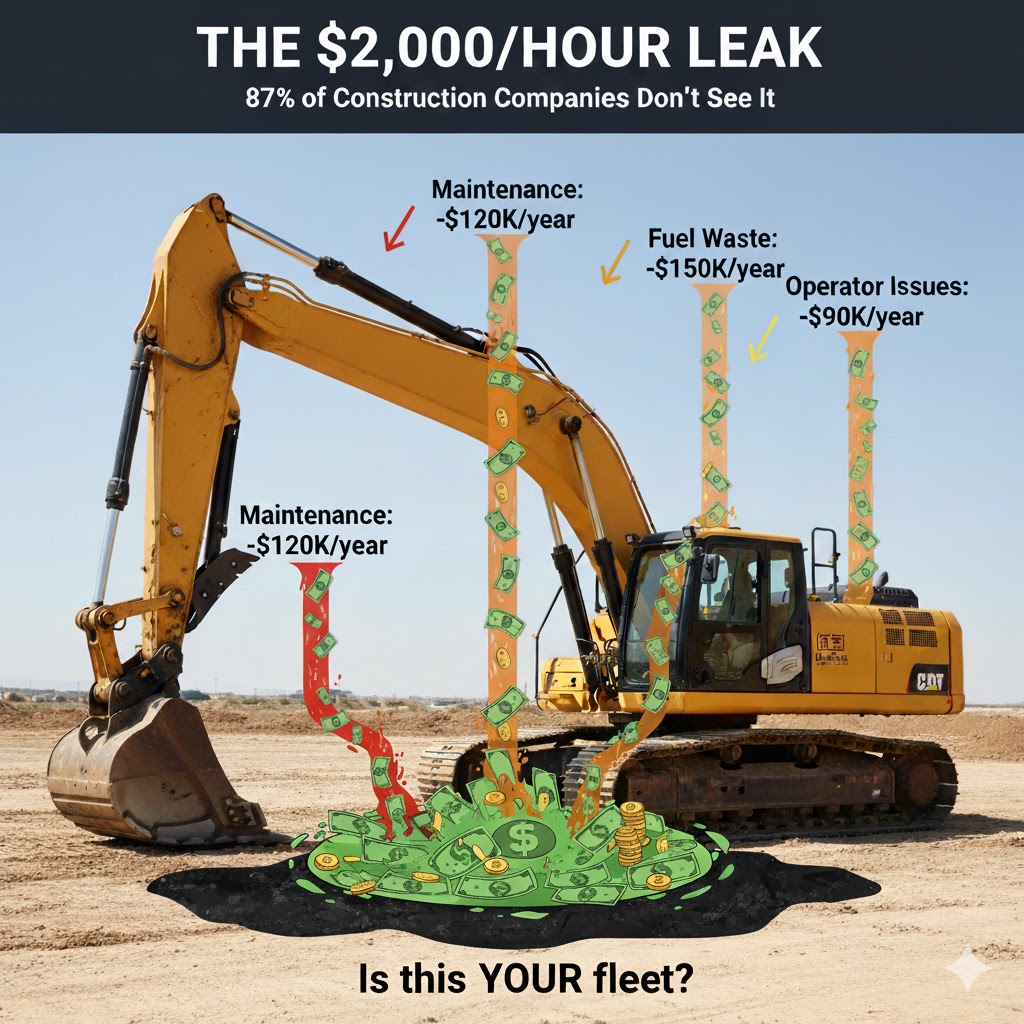
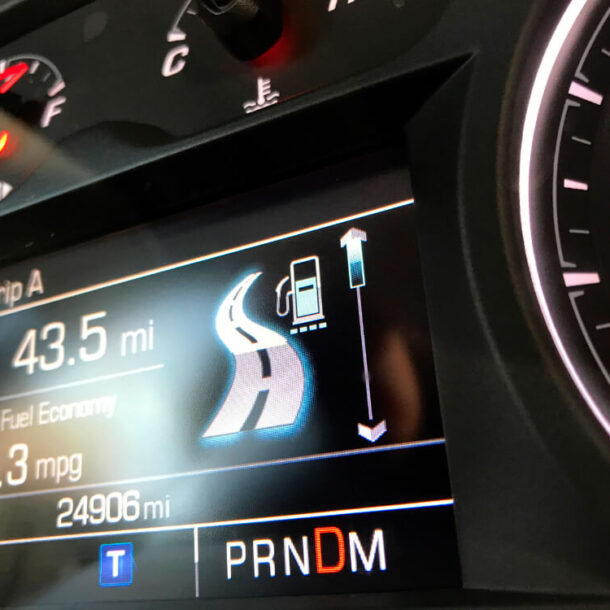
- Altos Costos de Combustible
- Costos de Mantenimiento Inesperados
- Operaciones optimizadas
- Entregas exitosas sensibles a la temperatura
- ELD & DVIR
- Altos Costos de Seguro
- Variedad de reportes automatizados
- Problemas de Desempeño del Conductor
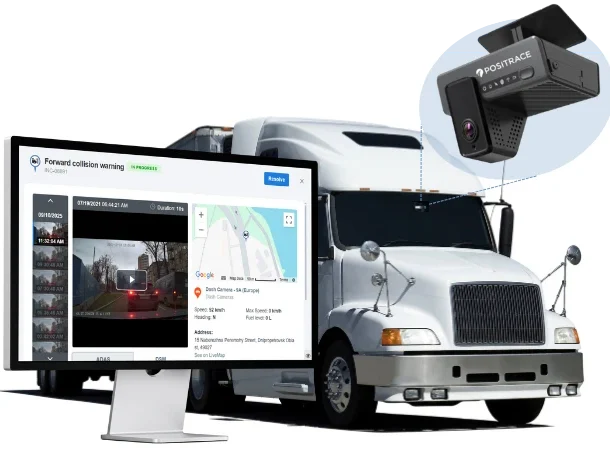
- Reducción de accidentes con video sobre demanda y en tiempo real
- Presión de neumáticos
- Robo de Vehículos y Seguridad
- Forge AI
- Industrias
- Productos
- Precios
- Recursos
- Compañía